
Software engineering continues to evolve and mature. As applications, services, and systems become increasingly complex, having the proper developer’s toolbox to help you optimize and perfect your solutions is essential. This blog post explores the top debugging tools you can leverage for excellence.
We’ll start by discussing the process of debugging and different terms you should be familiar with. After that, we’ll cover what you should expect from a debugging tool and the top features of a debugging solution that are must-haves. Finally, we’ll look at the top 12 debugging tools you should consider having in your development toolbox. We’ll explore solutions for different languages, where you can get them, how much they cost, and how to get started.
What is Debugging?
Debugging is the process of identifying actual and potential bugs within your code and fixing them. A debugging tool helps you complete this process more efficiently, and when used effectively, can further elevate the accuracy and performance of your code.
If you write code as a career or as a hobby, you will make mistakes from time to time. These mistakes appear as logic, syntax, or even errors where the code is technically correct, but the engineer should optimize the solution for a production environment. These “bugs” can be hard to find, replicate, or resolve – and, in most cases, it’s a combination of all three.
Why is Debugging Important?
Debugging your code not only improves the quality of the code but also provides an opportunity to dig deeper into the libraries and aspects of the language itself so you can better understand how your application works. A comprehensive debugging session should leave you and your code in a much better situation – the right debugging tool only enhances that effect.
Selecting the Right Debugging Tool
Before we discuss the qualities or characteristics of a good debugging tool, let's first consider what problem we're trying to solve. Ideally, we're looking for a tool that helps us identify the source of the problem. But identifying the problem is only half the battle. Once we know where the problem exists, a good debugging tool will go on to suggest how to resolve the issue or improve the code in question. The greatest assets that we have are the engineer’s mind and his or her training in developing code; the goal of a debugging tool is not to replace engineers, but rather, to augment their intelligence and problem-solving abilities.
With this problem statement in mind, and with the desire for a tool that can enhance the development capabilities of our engineers, let’s explore the debugging solutions available in 2023 that best address these concerns.
1. Visual Studio Code (VSCode)
Visual Studio is the IDE of choice for software practitioners across multiple disciplines. The built-in debugging functionality supports engineers developing in Node.js, PHP, Go, C#, and countless other languages due to its extensible support for most modern language choices.
When you run VSCode in debugger mode (Ctrl+Shift+D), you can set breakpoints and use watches to observe the values contained in variables. You can also step through each line of your code to understand how each line interacts with these variables and the path taken with each execution of the code.
You can learn more about the debugger in the VSCode Docs. The documentation applies specifically to the built-in Node.js debugger, but many extensions offer similar functionality within your chosen language.
2. Chrome DevTools
If you develop web applications, you may already know the developer tools, or Chrome DevTools, included with the Chrome Browser. With these tools (Right Click > Inspect), you can explore the DOM, CSS, and JavaScript as well as make changes to see how these affect the user experience.
Chrome DevTools also includes metrics about how the browser downloads and renders different components. You can view these on the Network tab or start a trace on the Performance Insights tab to create and review a timeline of how page elements are downloaded and rendered.
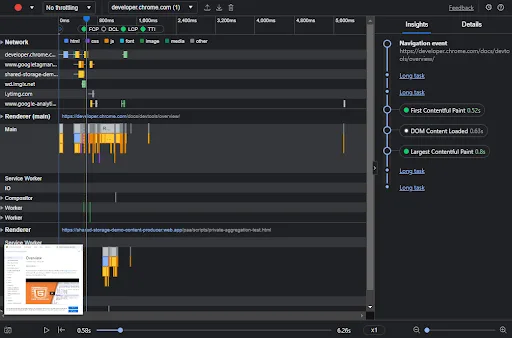
Fig. 1 – Performance Insights in Chrome DevTools
3. ReSharper
ReSharper is a Visual Studio Extension from JetBrains, the industry-leading company behind such tools as IntelliJ IDEA, PyCharm, and WebStorm. As a Java engineer, I’ve used IntelliJ for years to quickly analyze and debug my code, safely refactor large code bases, and receive IntelliSense suggestions for line completion, code optimization, and coding standards. With the ReSharper extension in Visual Studio, .Net engineers can enhance their development practices with a similar toolkit.
The overwhelming benefit of productivity tools like ReSharper is that you don’t need to launch a separate process to optimize and debug your code. ReSharper provides insights and suggestions as well as highlights bugs and potential errors as you are writing and editing code, saving you time and helping to improve the efficiency and quality of your code as you write it. Configuration options allow you to adapt the tool to your team and organization's coding style and standards.
4. PyCharm Debugger
If you develop Python code, the PyCharm IDE and the included PyCharm Debugger (also from the experts at JetBrains) are essential. Much like ReSharper and the debuggers in other JetBrains products, this tool allows you to set breakpoints and step through your code, checking variables as you proceed.
The PyCharm debugger works alongside you as you code, highlighting syntax errors and bugs as well as suggesting optimizations. This enables you to debug as you type and reduces the need to execute the code or fire up the debugging process.
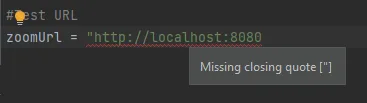
Fig. 2 – PyCharm Debugger at Work
5. Xcode
Swift and SwiftUI developers may be familiar with Xcode, the IDE built for MacOS by Apple. The Xcode Debugger integrates seamlessly into the editor, allowing the developer to set breakpoints and step through the code to narrow down the source of an error, logic problem, or other code bug.
A new addition to the Xcode Debugger’s functionality is the Debug Console, which displays logs from your application. The console allows you to filter and sort logs. The logs are color-coded based on severity and type, and they include additional details about the origin of the log with relevant details and a link directly back to the code where it originated.
6. Android Studio
Built on top of the prevalent Eclipse integrated development environment, Google configured Android Studio with the Android developer in mind. The included Android Studio Debugger contains emulators that have debugging enabled by default. The Debugger supports Java, Kotlin, and C/C++ code. It allows the developer to set breakpoints, step through the code, and view the values stored in each variable at each point in the process. If you’re running your code on a physical device, you can attach the Debugger directly to it with all the same features enabled.
Some additional features available in the Android Studio Debugger include the logging console on the Logcat tab and a variety of breakpoint options to help you zero in on any bugs. You can set breakpoints on a specific line or a specific method. You can also set breakpoints to pause code execution whenever data is read or written to an identified field or a conditional breakpoint that will only pause the code in the case of defined conditions.
7. dbForge SQL Tools
Software engineers aren’t limited to development on pure software projects. Often, our skills extend to database development, and these assignments require many of the same skills as traditional development, including debugging, code optimization, and troubleshooting. To address this need, dbForge SQL Tools helps engineers improve the efficiency and quality of their SQL Server and Azure SQL queries and stored procedures.
With SQL Tools, database engineers have autocompletion, refactoring support, and optimization suggestions. Whether you are building a new store procedure, optimizing a complex query, or analyzing your schema for better performance, SQL Tools have you covered and allow you to do more faster and more accurately than ever before.
8. Telerik Fiddler
Telerik Fiddler, which is available in several different flavors, is a web debugging proxy that allows you to intercept and view traffic between your browser and external servers, APIs, and other internet locations. Supporting most protocols, such as HTTPS, WebSocket, and gRPC, Fiddler lets you view, modify, and even craft custom payloads to troubleshoot, validate, and help you zero in on problems within your applications. Filters and rules can further support engineers in refining their view of traffic and targeting specific payloads for action.
Telerik offers the following Fiddlers to meet your needs:
Fiddler Everywhere – A web debugging proxy for Windows, MacOS, and Linux.
Fiddler Classic – The original debugging proxy (available only on Windows).
Fiddler Jam – A web-based proxy that is quick and easy to configure.
FiddlerCap – A desktop proxy for Windows with advanced analysis and sharing capabilities.
FiddleCore – A .NET library that allows you to integrate the Fiddler into your applications to enhance system observability and alerting.
9. Eclipse Debugging Tools
The Eclipse IDE is an open-source Java IDE from the Eclipse organization. Eclipse, a favorite among many Java engineers, offers many features that integrate with the debugger included with the Java Development Toolkit (JDT). The Eclipse Debugging Tools allow you to set breakpoints and step through your code while viewing the contents of variables as the code interacts with them.
As an open-source community project, you can choose from the default debugging tools or integrate other debugging plugins to add additional functionality and customize the IDE to best support your development and debugging needs. While Eclipse is primarily a Java development and debugging tool, you can also extend Eclipse to support other languages – as evidenced by the tremendously successful Android Studio we discussed previously.
10. WinDbg (Windows Debugger)
Almost all of the debuggers in this list address the need to debug code for a specific project or application. Sometimes, bugs exist outside this scope and may result from interactions with other applications or the operating system. If you’re on a Windows machine, you can now use WinDbg, the Windows Debugger, to expand debugging beyond your application.
WinDbg allows users to explore crash dumps and analyze this data for problems. You can also debug in either a live user mode or kernel mode that will enable you to examine your workstation's memory and CPU registers.
11. IntelliJ IDEA
No list of the top debuggers would be complete without my personal favorite. I use IntelliJ IDEA daily to identify problems, optimize my code, and continue to improve my development skills. As the original JetBrains IDE, IntelliJ IDEA includes a robust suite of debugging tools with IntelliSense to increase your coding velocity as well as optimize your code for performance and readability as you type.
The debugger itself supports breakpoints and watches as well as step-through and step-over options. This helps you move through the code while it is running and get into each line and process to isolate potential problems.
12. Sauce Labs
Sauce Labs is a leader in continuous testing solutions for websites, web applications, and mobile applications. Sauce Labs offers a suite of intelligent software debugging tools that enable engineering teams to debug web and mobile applications across the entire SDLC, from production to post-release, efficiently and cost-effectively.
With Sauce Labs’ intelligent software debugging tools, development teams can accelerate root cause analysis, prioritize impactful bugs, and remediate issues before they reach customers.
Sauce Labs software debugging suite includes:
Real device cloud: Run automated and manual mobile app tests securely from anywhere, anytime. Increase team productivity with instant access to the most extensive range of iOS and Android devices, operating systems, and test automation frameworks. Debug and release faster with error monitoring and reporting.
Live testing + dev tools: Validate functionality and user experience in real time with live testing on thousands of emulators/simulators, real devices, and browser/OS configurations. Diagnose and debug quicker with Chrome DevTools and Safari Web Inspector.
Mobile app diagnostics: Determine the root cause of errors in your code and test failures in the pipeline quickly.
Mobile beta testing: Receive user-submitted issues and automatically capture crash data to quickly identify bugs. Leverage video logs and screenshots to reproduce and solve issues.
Failure analysis: Leverage machine learning algorithms to uncover failure patterns, prioritize the most detrimental issues and predict featured bugs.
Error reporting: Monitor crashes and errors in production. Prioritize the most impactful errors and get alerted of new issues across all your applications platforms: web, mobile, server, and gaming.
Taking Debugging to the Next Level
Which debugging tool you choose should depend on your type of development environment and the language or IDE you use. All the debuggers listed here are well-designed and intuitive, and they will have you finding and fixing bugs with minimal configuration or learning required.
Each debugger contains a wealth of features and abilities that take time and effort to learn. In the same way that you devote yourself to development practices and learning more about the intricacies of the language your code in, investing the time to explore the features of your debugger and become proficient in its use will have an exponential payoff in terms of efficiency and the quality of your code.
More debugging resources


Jump to content
What is Debugging?
Why is Debugging Important?
Selecting the Right Debugging Tool
Visual Studio Code (VSCode)
Chrome DevTools
ReSharper
PyCharm Debugger
Xcode
Android Studio
dbForge SQL Tools
Telerik Fiddler
Eclipse Debugging Tools
WinDbg (Windows Debugger)
IntelliJ IDEA
Sauce Labs