When tests fail, users often ask "Why do I spend so much time debugging tests and often can’t find the issue?" and “My tests fail randomly and I know it’s not the test, how do I get more visibility into the source of my test failures?” Today, we provide a way to answer these questions with Extended Debugging.
When a test fails and it’s not an app issue, users want to dive into execution details of how the test was run. In particular, flaky tests are those that fail for no obvious reason – so the failure is usually assigned to the testing infrastructure. To better understand these failures, testers want to access browser execution and networking data. There are two sources of this data:
Browser console logs give details of how JavaScript is executed by the browser (including execution errors and warnings)
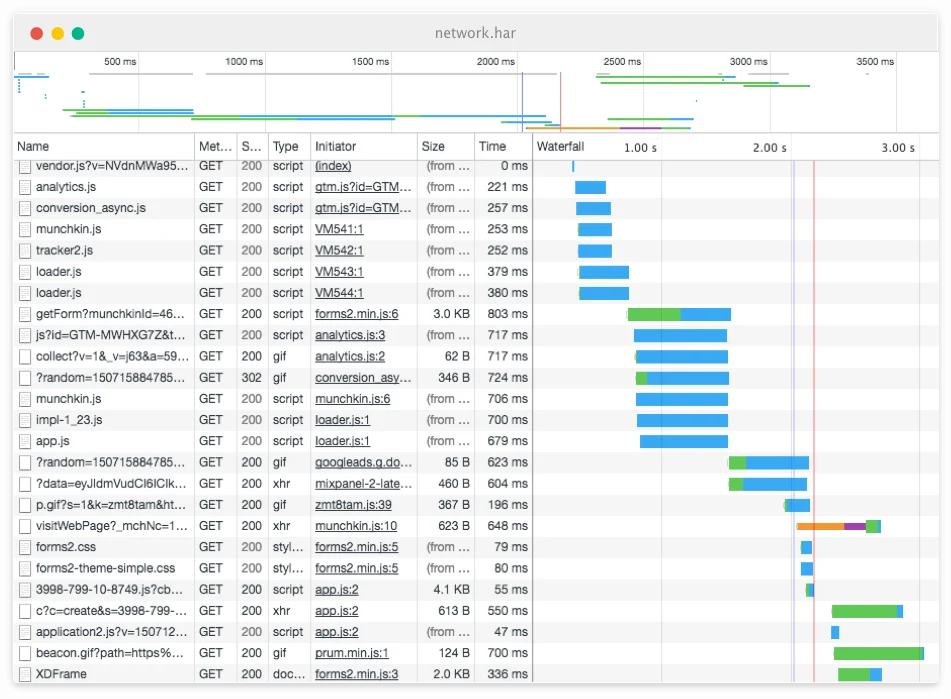
HAR (HTTP Archive Files) provide the details of requests / responses that the browser has made during the test execution process (which browser requests have timed out, not loaded or slowed down the loading process as well as faulty API calls).
Extended Debugging provides additional information to help users debug the Selenium tests they run on the Sauce Labs platform. The feature helps you understand app issues and pinpoint the root cause of test failure by providing JS Console log and networking logs with each automated test. With these data, developers gain insights into browser and networking issues to help them more quickly identify the root causes of test failures.
Update: Extended Debugging is now GA. Take me to the docs.


