



We are living in a time where richer inter-app communication and tighter integration with the OS services is available in mobile, and iOS is no exception. iOS App extensions enable you to extend your reach beyond the process of presenting the UI. You can capture screen, intercept network, or interact with an Apple Watch while other apps are running in the foreground.
These extensions run in their own, sandboxed processes, and require extra care to monitor them in production. In this post, we are going to take a look at how Backtrace SDK can help us in our example Keyboard Extension.
You can find a pair of sample projects below if you prefer jumping right into it.
Requirements
You'll need the latest Xcode and backtrace-cocoa SDK. CocoaPods CLI is not required.
Steps
Download SDK
Download the latest archive from backtrace-cocoa releases. Make sure you pick bitcode=YES embedded=YES flavor.
Launch your Xcode project.
Copy these into your project root by drag and dropping them into Project Navigator.
Rome/Backtrace.framework
Rome/Backtrace_PLCrashReporter.framework
Rome/Cassette.framework
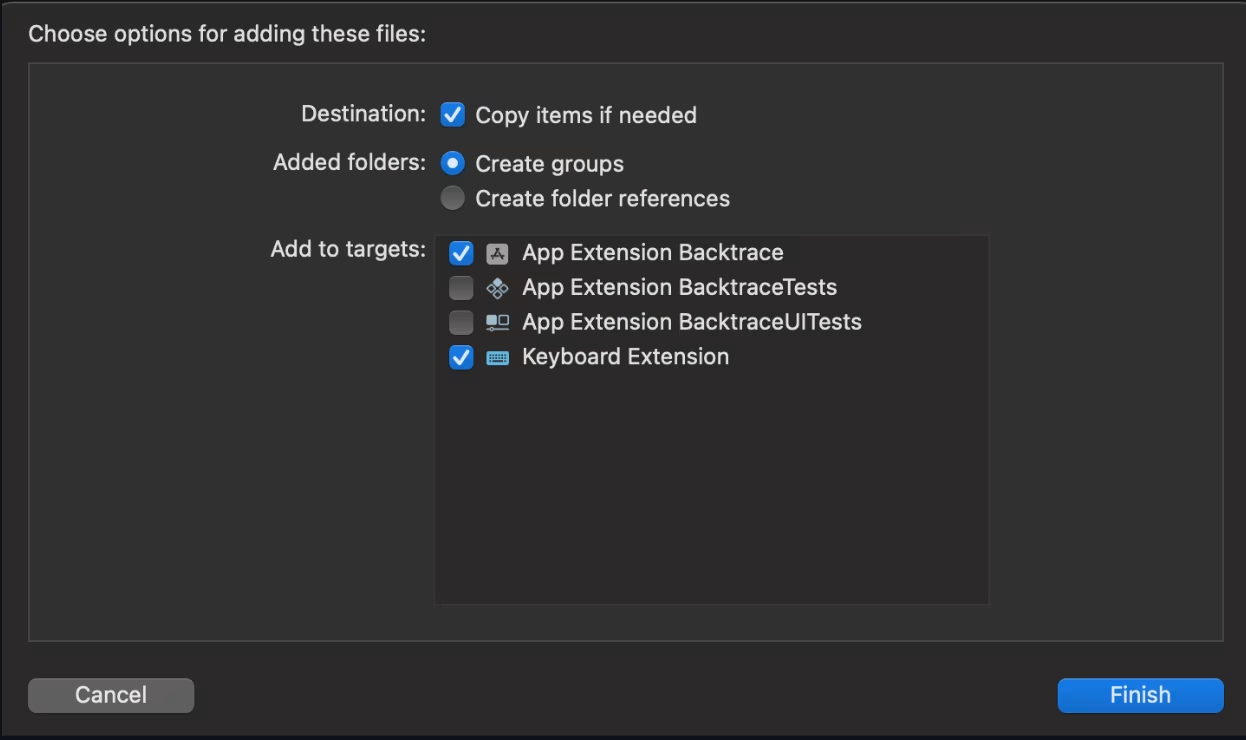
Select your app and all extensions in the prompted dialog.
Configure Xcode Project
Navigate to each build target's General settings (i.e., your app and each extension).
Locate Framework, Libraries, and Embedded Content for apps and Frameworks and Libraries for extensions.
Add all the new frameworks to your targets if missing. Set embedding settings as Embed without Signing.
Navigate to Build Phases > Embed Frameworks and make sure all the frameworks are added there (app and extension targets).
Navigate to Build Settings and change Debug Information Format to Dwarf with dSYM File (app and extension targets).
Add Sources
Create a new directory with Finder in your project and name it Backtrace.
Copy all ".h" files in Backtrace.framework/Headers and Backtrace_PLCrashReporter.framework/Headers into the newly created directory.
Go back to Xcode and add Backtrace by drag & dropping it into Project Navigator. If you get prompted to add bridging header files, accept it.
Make sure files are added to all targets in the prompted dialog.
Create a new Obj-C class in your project (i.e., BacktraceWrapper.h and BacktraceWrapper.m). If asked, allow Xcode to create bridging headers for the targets that utilize Swift.
BacktraceWrapper.h
#import <Foundation/Foundation.h>

NS_ASSUME_NONNULL_BEGIN

@interface BacktraceWrapper : NSObject

+(void)sendError:(NSError*)error attributes:(NSDictionary*)extra;

@end

NS_ASSUME_NONNULL_END
BacktraceWrapper.m
#import "BacktraceWrapper.h"
#if defined(__arm64__) && __arm64__
#import "Backtrace-Swift.h"
#import "Backtrace-PLCrashReporter-umbrella.h"
#endif

@implementation BacktraceWrapper

#pragma mark Globals
#if defined(__arm64__) && __arm64__
static BacktraceClient* client;
#endif

#pragma mark Private

+(void)initializeBacktrace {
#if defined(__arm64__) && __arm64__
    if (client != nil) {
        return;
    }

    BacktraceCredentials* credentials = [[BacktraceCredentials alloc] initWithSubmissionUrl: [NSURL URLWithString: @"https://submit.backtrace.io/BACKTRACE_SUBDOMAIN/BACKTRACE_SUBMISSION_TOKEN/plcrash"]];

    BacktraceDatabaseSettings *dbSettings = [[BacktraceDatabaseSettings alloc] init];
    dbSettings.maxRecordCount = 10;

    BacktraceClientConfiguration *configuration = [[BacktraceClientConfiguration alloc]
                                                initWithCredentials: credentials
                                                dbSettings: dbSettings
                                                reportsPerMin: 30 // Default is 30
                                                allowsAttachingDebugger: FALSE // If false, disables backtrace during development
                                                detectOOM: FALSE];


    BacktraceCrashReporter* crashReporter = [[BacktraceCrashReporter alloc] initWithConfig: PLCrashReporterConfig.defaultConfiguration];
    client = [[BacktraceClient alloc] initWithConfiguration:configuration crashReporter:crashReporter error:nil];

    [client.metrics enableWithSettings:[[BacktraceMetricsSettings alloc] init]];
#endif
}


#pragma mark Public

+(void)sendError:(NSError*)error attributes:(NSDictionary*)extra {
#if defined(__arm64__) && __arm64__
    [self initializeBacktrace];
    [client sendWithError:error attachmentPaths:@[] completion:^(BacktraceResult * _Nonnull result) {
        NSLog(@"Backtrace error sent: %@", [error description]);
    }];
#endif
}

@end
Swift Support
If you want to expose BacktraceWrapper to your SWIFT files, add the following line to your bridging headers:
#import "BacktraceWrapper.h"
BacktraceWrapper.sendError(error: Error) will become available to your Swift code.
Upload Symbols with CI
Once you are ready to distribute your app, run the commands below in your CI to upload debug symbols to Backtrace.
cd $DERIVED_DATA_PATH/Build/Products/Debug-iphoneos/

zip -r symbols.zip *.dSYM
curl --fail-with-body --data-binary @symbols.zip -X POST -H "Expect: gzip" "https://submit.backtrace.io/$BACKTRACE_SUBDOMAIN/$BACKTRACE_SYMBOLS_ACCESS_TOKEN/symbols"
Final Words
From now on, your extensions will have the same error reporting capabilities that your app has. We know how painful it can become to debug custom keyboards or video calls in production especially when they crash silently with no useful error messages. Those days are now in the past.
We’d love to hear your feedback! We have recently added support for Swift Package Manager which will simplify working with App Extensions even further.
This article was originally published in January 2023 and has been updated in May 2023.

Stop letting QA be the bottleneck on AI-speed development.
Stop letting QA be the bottleneck on AI-speed development.