Blog
Cut Your Error Resolution Time In Half With Mobile Crash And Error Reporting
Fixing mobile software errors is a collaborative effort. Errors and crashes will be identified throughout the software development lifecycle (SDLC) by QA, testers, customer support, or users themselves. Unfortunately, there is often a time lag and loss of information as these errors get routed to the programmers who can further triage and resolve. The Sauce Labs Mobile Crash and Error Reporting solution (Backtrace) helps address these challenges by providing best-in-class error capture, prioritization, and resolution flows to help companies cut their time to detection and resolution of issues in half.

Cut resolution time in half? Tell me more!
To illustrate this point, let’s take the example of a support scenario from one of our mobile customers, Halfbrick Studios, developer of the popular Fruit Ninja franchise. Like other mobile app and game developers, once the game is released the Halfbrick team needs to ensure they are always on top of crashes and errors seen by their players, so they can quickly issue patches and keep customer satisfaction high.
Before Backtrace, the tool they used to capture errors and crashes was not very helpful. It could not search for the information they needed, didn’t integrate well with their Jira and customer support systems, and the grouping (or de-duplication) or errors was not very accurate. This resulted in longer times to detect and resolve the issues that mattered to them (14 days on average).
They integrated Backtrace to improve this process. Now, whenever a customer raises a support ticket to complain about a crash or error problem, the Support and QA leads who manage inbound bugs can search Backtrace with the user ID to see the status of the error or crash group that the player encountered. Even if they don’t understand the technical details, they can identify if the issues are being worked on, or if it needs a little boost in priority based on the business impact of the issue.
Developers, who understand the technical details and are ultimately tasked with resolving the issue, have access to a rich post-mortem debugging and data analysis environment directly from the Jira ticket used to manage their work. This allows them to identify the root cause and create a patch, and with two-way Jira sync, ensure that Backtrace knows when a fix is available so it can set up logic to identify regressions if they occur. By simply starting to use Backtrace instead of their alternative solution, the average time to resolution is now 7 days.
How does Backtrace do it?
We worked with customers across technologies and industries to identify the gaps they have in their existing crash and error reporting flows, and relentlessly focus on improving them. Here are the primary reasons that our customer's site for choosing Backtrace error & crash reporting:
Better and more accurate call stacks
Backtrace implements sophisticated unwinding and symbolication techniques and heuristics to provide more accurate information.
Enhanced regression detection
Errors can be marked as ‘Fixed in a certain version’. If the error occurs again in a future version, Backtrace can reopen any linked Jira issue, send alerts to defined channels, and track where the regression was first detected.
Seamless integrations with tools you use daily
By integrating with the tools your team uses for daily collaboration and ticket tracking, Backtrace helps ensure that the most impactful issues get the attention they need and can be tracked via your standard tools.
Two-way integration with Jira ensures assignments and issue states are kept in sync.
Powerful query and analytics
All metadata points are indexable and can be queried, aggregated, and visualized with powerful operators.
Key features to serve error & crash reporting needs across Dev, QA, and Support teams
When it comes to mobile apps, Backtrace provides these critical capabilities to helps teams ship high-quality mobile apps faster:
Easy installation
Cocoapods for iOS, tvOS (Swift, Objective C)
Gradle/maven for Android/FireOS (Java, Kotlin)
Customizable capture all exceptions, crashes, hangs, and low-memory events.
Support for dSYM and ProGuard to generate readable function names, file paths, and line numbers for native crashes
Accurate and flexible grouping for non-fatal errors, crashes, hangs, and low-memory events
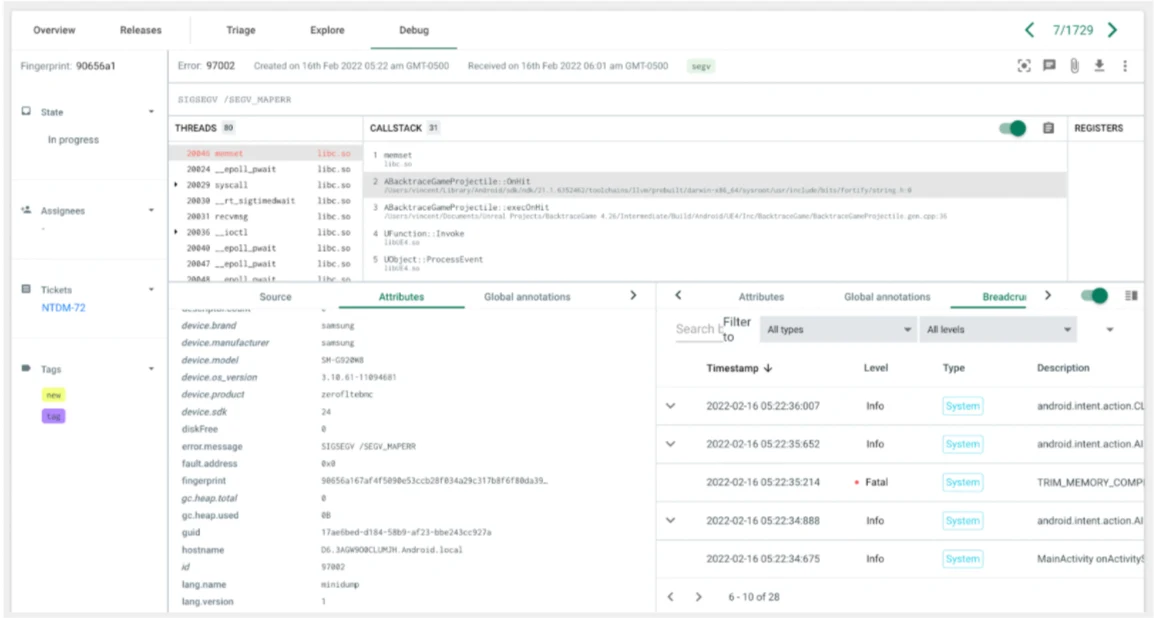
System information, custom metadata, breadcrumbs, and attachments
Release comparison
Compare user adoption, stability, and new errors across releases
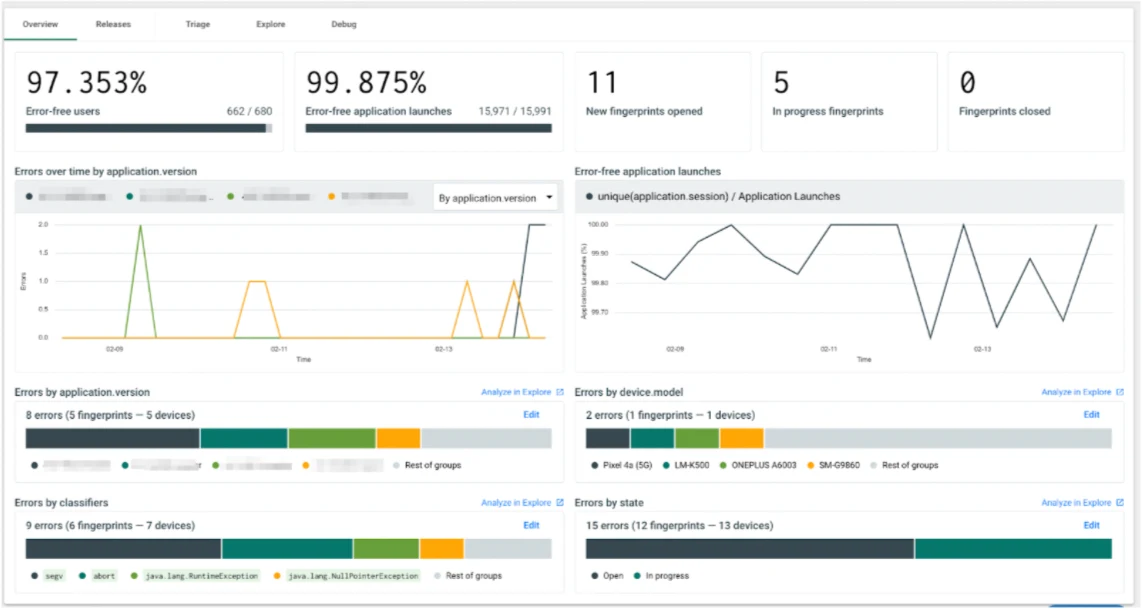
Error-free metrics
Automatically compute crash-free, hang-free, or error-free rates against customizable dimensions such as OS (iOS vs. Android), or App versions
Feature-rich post-mortem debugger that provides access to all threads, call stacks, registers, system and custom metadata, global annotations, and file attachments to support speedy resolution.
Offline client crash capture/storage for future collection
Customizable event handlers and base classes
Take your next steps towards faster mobile error resolution
Sign up for our free developer tier today, or contact us to set up a more in-depth trial.


